Ah, the “Dome Quarterback.” It’s a popular narrative with football pundits and analysts, especially in the fantasy football community. The idea behind this narrative (unsubstantiated and a myth, in my opinion) is that some quarterbacks play better in domed stadiums than they do in outdoor stadiums.
This article in Sports Illustrated made the case that Jared Goff (Detroit Lions quarterback) could have a career year in 2024. Why? Because he’d be mostly playing indoors, and Goff is a “dome quarterback.” To back up his claim, the article’s author points out that in 2023, “in indoor settings, [Goff] completed 69% of his passes, … threw for 23 touchdowns… 8 interceptions and 2981 yards [with a] 104.0 quarterback rating. Meanwhile, [in outdoor stadiums]… he completed just 64.5 percent [of his passes]… threw for 7 touchdowns, 4 interceptions, and 1594 yards.. [with a] QB rating of just 87.9.”
Let’s sum that up. The article’s author, John Maakaron, notes the following:
| Stadium Type | Touchdowns | Interceptions | Yards | Passer Rating | Completion % |
|---|---|---|---|---|---|
| Indoor | 23 | 8 | 2981 | 104.0 | 69% |
| Outdoor | 7 | 4 | 1594 | 87.9 | 64% |
Let’s set aside the fact that football is a high-variance sport, both in general output and individual performances across the season. Even the best quarterbacks experience plenty of ups and downs in a regular season; this is inevitable in a 17-game season, and is compounded by the inherent randomness and complexity of the sport. I’ll show later that this kind of variability is not out of the norm on any given Sunday.
But even without more in-depth statistical analysis to assess Maakaron’s claim, we can already see a glaring omission in how he presents his argument: the number of games played indoors vs outdoors. 23 touchdowns vs 7, 8 interceptions vs 4, and 2981 yards vs 1595 (a nearly 47% decrease!) sure seem like stark differences. The effect is dampeped considerably, however, when we note that Goff played 13 out of 20 games indoors in 2023, compared to 7 games in outdoor stadiums. In other words, he played nearly twice as many games inside as he did outside.
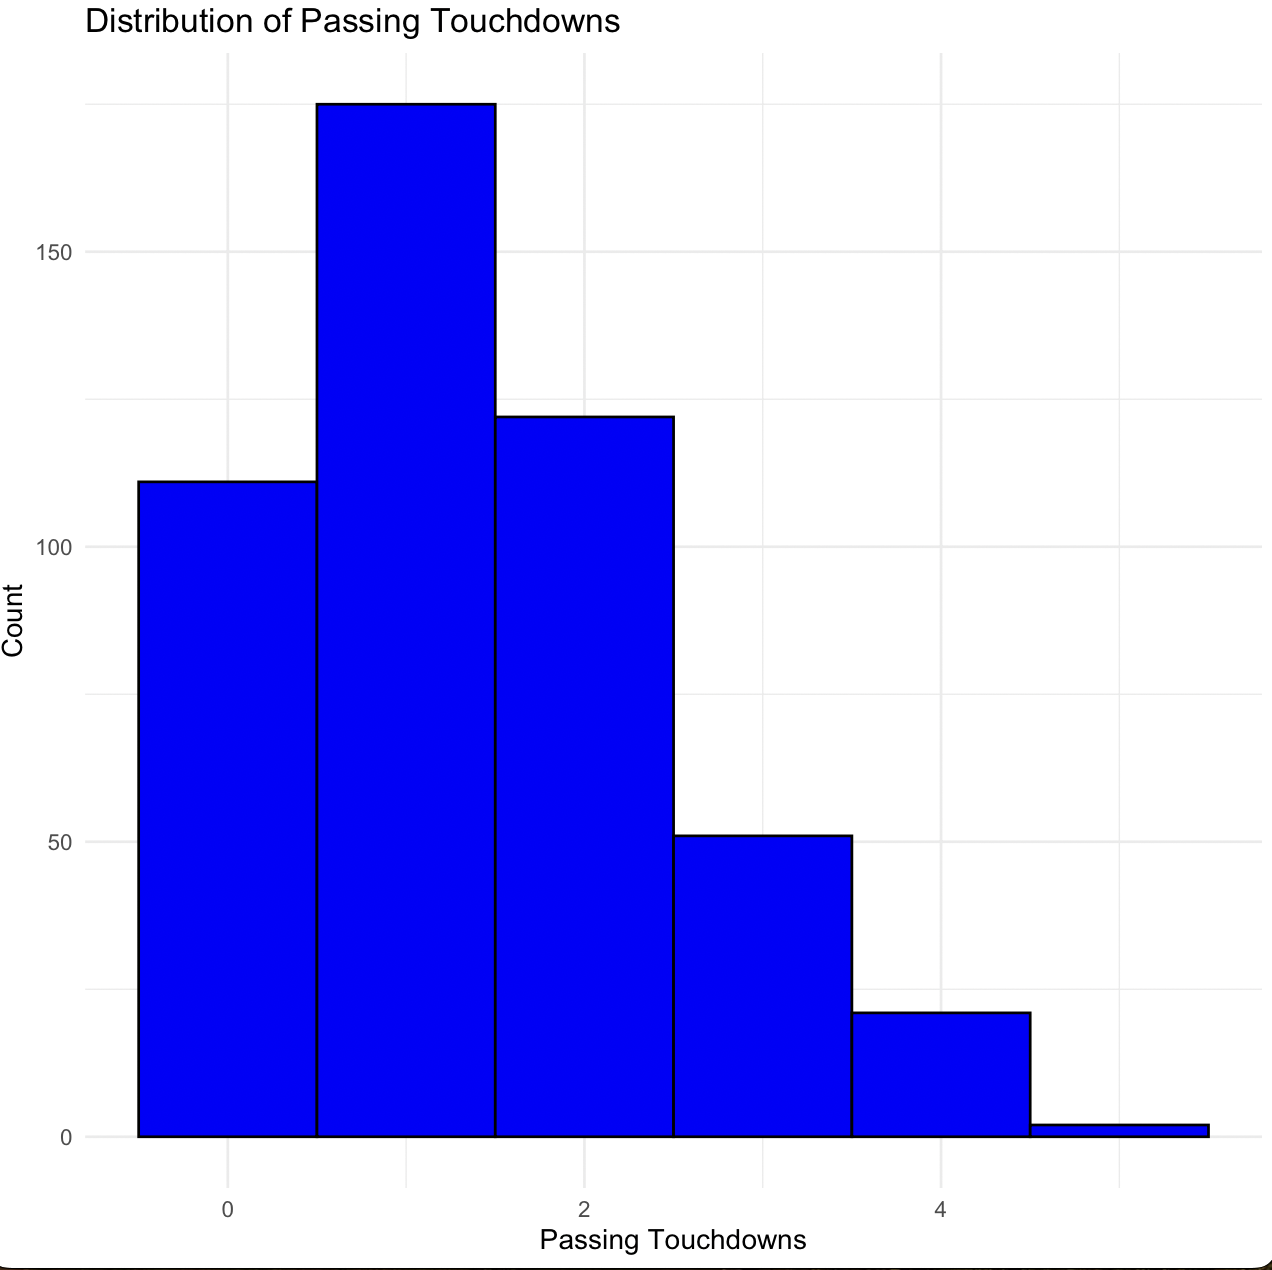
Passing touchdowns aren’t a sticky stat, whether you’re looking at them from game to game or from year to year. Hilariously, while QBs in 2023 averaged 1.25 passing touchdowns per game, the standard deviation was a whole 1.08 touchdowns - a huge spread. Even when we increase our mininum passing attempts filter from 50 to 300 to move the needle in favor of season-long quarterbacks, the average only increases to 1.38, with the standard deviation again inching up slightly to 1.1.

So we know that there’s already a broad distribution when it comes to touchdowns. This goes a long way toward explaining that, when we factor in the stadium split, Goff averaged 1.77 touchdowns per indoor game, compared to 1 touchdown per outdoor game. The differences get even smaller from there.
He averaged 229 passing yards per game in indoor stadiums. In outdoor stadiums? Almost identical, at 227 passing yards. Interceptions? .62 per game in indoor stadiums, .57 per game in outdoor stadiums (meaning he improved when it came to interceptions in outdoor stadiums, since fewer is better, although of course, we know that .05 difference is meaningless.) So by most metrics, he played nearly identically in indoor vs outdoor stadiums, with the only noticeable difference coming in his touchdown average (which, as discussed, is a high variance statistic.)
| Stadium Type | Touchdowns per game | Interceptions per game | Yards per game |
|---|---|---|---|
| Indoor | 1.7 | 0.62 | 229 |
| Outdoor | 1.0 | 0.57 | 227 |
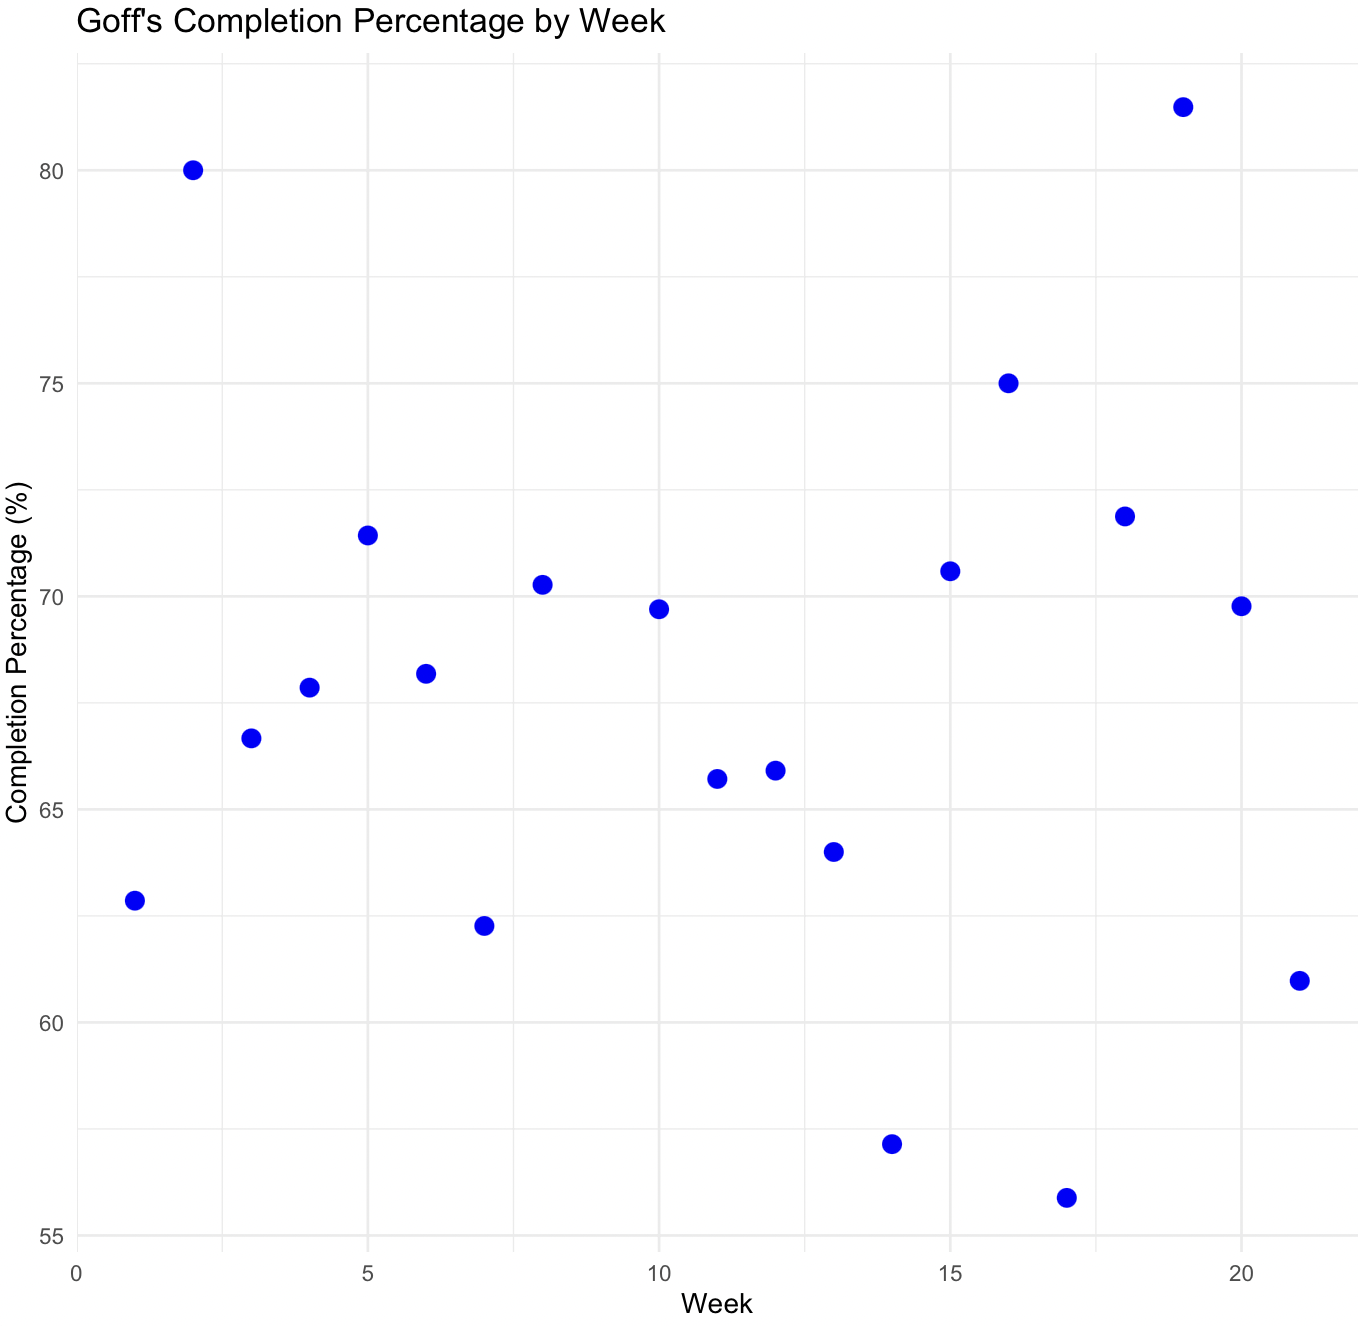
What about the differences in quarterback rating and completion percentage? Maakaron notes that Goff completed 69% of his passes in indoor stadiums vs 64% in outdoor stadiums. Looking at 55 different quarterbacks (not including Goff, so as to not let his statistics skew the numbers if he is, in fact, a “dome quarterback”) with a minimum of 50 pass attempts in the season, the league mean in completion percentage was 63.9% (compared to Goff’s 69% and 64%). But the standard deviation? 12.4%. Looking at Goff’s own numbers (admittedly a much smaller sample size of 20 games compared to the 590 instances of play by the other 55 quarterbacks), we see that he averaged a completion percentage of 67.9%, with a standard deviation of 6.6%.


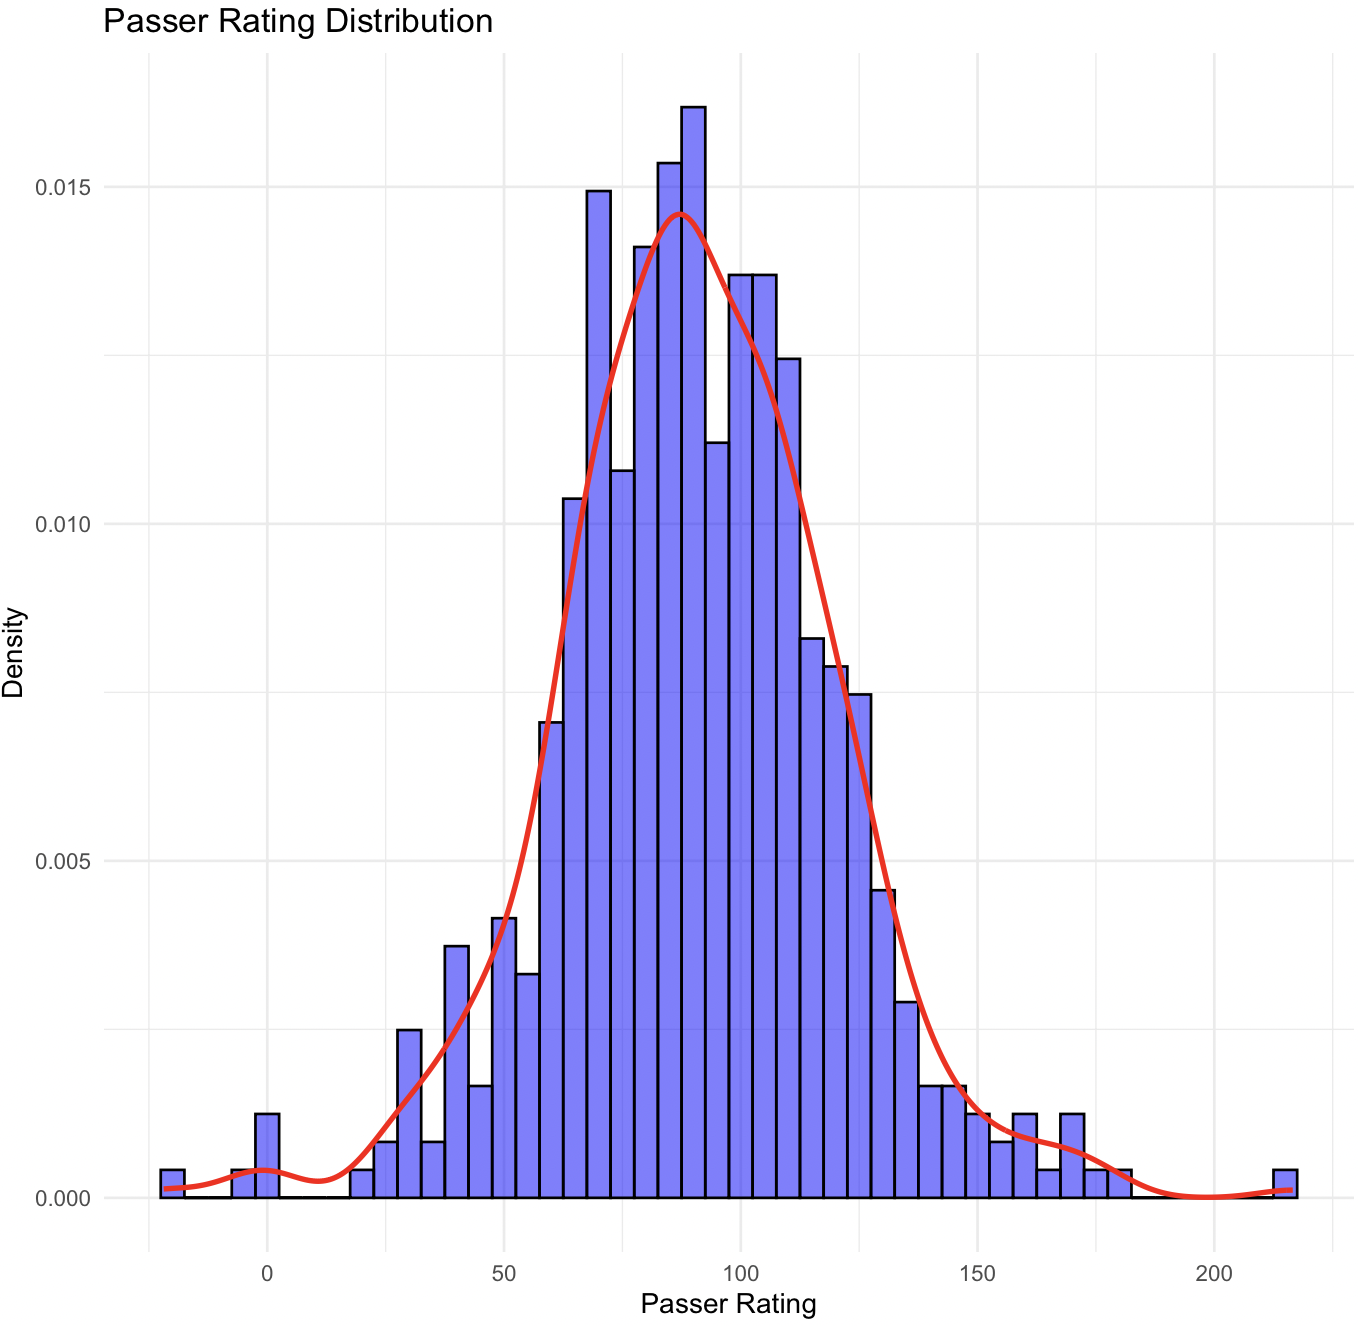
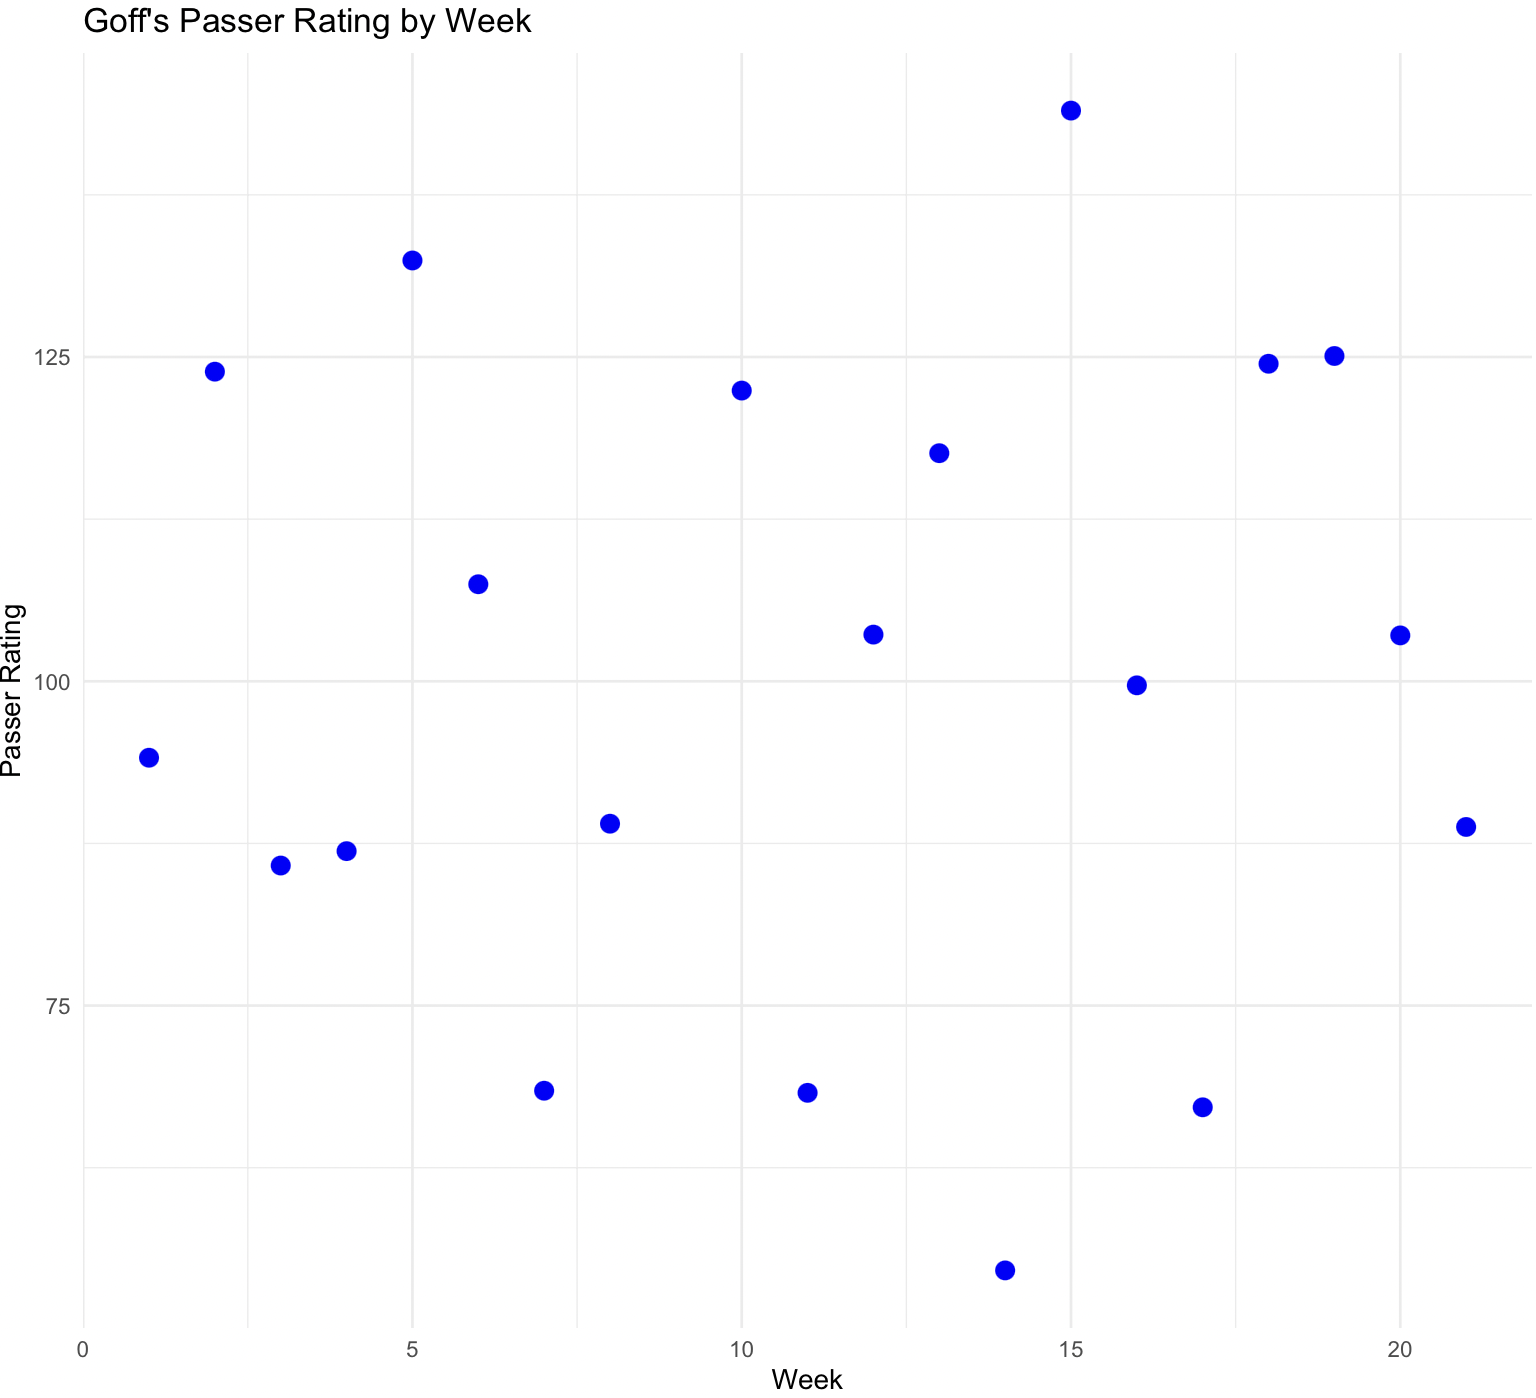
The same holds for passer rating. The league’s QBs (sans Goff) averaged a passer rating of 87.7, with a standard deviation of 30.7! Goff’s numbers: 100.4, with a standard deviation of 24.6.


Pending more data, the difference in Goff’s numbers in indoor vs outdoor stadiums is more easily and accurately explained by the high-variance nature of football, not him “being a California boy.” There’s simply no reason to think that Goff is uniquely impacted by the different conditions in domed vs un-domed settings relative to other quarterbacks. I suspect the same holds true for pretty much any other quarterback.
